SCILAB Templates
===========================ONE_LINERS==================================================
-->a=1 // a=1. load a real constant
-->1==1 // ans=T load a boolean
-->m=0 // ans=T load a boolean
-->~m // ans=T logical not tilda — (~) logical not
-->'string' // ans=string load a character string
-->path='/Users/donsauer/Downloads/' //
-->filepath=path +'filename' // filepath= /Users/donsauer/Downloads/filename
-->who_user() // User variables = filepath, path, m, a, home
-->%i // %i (for sqrt(-1))
-->%inf // %inf (for Infinity)
-->%pi // %pi (for 3.14...)
-->%T // %T (for "true")
-->dec2bin(7, 4) // 0111
-->bin2dec('1010') // 10
-->dec2hex(14) // E
-->hex2dec('E') // 14
-->int(3.14) // 3
-->floor(3.14) // 3
-->ceil([1.9 -2.5]) // 2. -2.
-->[m,n]=max([1,3,2]) // n=2,m=3
-->[m,n]=min([1,3,2]) // n=1,m=1
-->sign(-33) // -1
-->sqrt(-1) // i
-->modulo(-3,9) // -3.
-->abs([1,%i,-1,-%i,1+%i]) // 1. 1. 1. 1. 1.4142136
-->[n,m]=size(rand(3,2)) // m = 2. n = 3.
-->[n,m]=size(['a','b';'c','d']) // m = 2. n = 2.
-->ascii("scilab") // 115. 99. 105. 108. 97. 98.
-->ascii([115 99 105 108 97 98]) // scilab
-->home // home = /Users/donsauer
-->getos() // ans = Darwin
-->getshell() // ans = bash
-->n=input("How many iterations?") // wait for input
-->gethistory //
-->historysize()
-->savehistory('/session.scilab')
-->testmatrix('magi',3) // returns a magic square of size 3
-->testmatrix('frk',3) // returns the Franck matrix :
-->testmatrix('hilb',n) // inverse nxn Hilbert matrix (Hij= 1/(i+j-1)).
===========================MISC==================================================
-->a=1; b=2; // define a and b
-->Z=['a','sin(b)'] ; // define Z as an array of equations
-->eval(Z) // returns the matrix [1,0.909];
-->date=struct('d',25,'m','DEC','y',2006) // create a struct date
-->date.m='AUG';
-->date.y='1973';
-->for j= 4:-1:1, disp(j),end // 5. 4. 3. 2. 1.
--> i=2
for j = 1:3,
if i == j then a(i,j) = 2;
elseif abs(i-j) == 1 then a(i,j) = -1;
else a(i,j) = 0;
end,
end
-->x = linspace(-10, 10, 5) // x = - 10. - 5. 0. 5. 10.
-->x = logspace(1,2,5) // x = 10 17.8 31.6 56.2 100
-->x0=0;
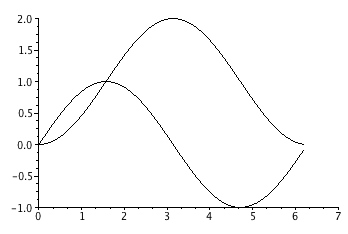
-->x1=0:0.1:2*%pi;
-->x2=sin(x1);
-->x3=integrate('sin(x)','x',x0,x1); // integrate('equa','value',x0,x1);
-->plot2d(x1,x2);
-->plot2d(x1,x3);
===========================ARRAY==================================================
-->A=[a+1 2 3
--> 0 0 atan(1)
--> 5 9 -1 ] // load a 3 x 3 constant matrix
A=2. 2. 3.
0. 0. 0.7853982
5. 9. - 1.
-->A(2,3) // ans = 0.7853982
-->x = rand(3, 2) // load a 4 x 4 constant matrix
x = 0.2113249 0.3303271
0.7560439 0.6653811
0.0002211 0.6283918
-->x(:,1)
= 0.2113249
0.7560439
0.0002211
-->x(:,2)
= 0.3303271
0.6653811
0.6283918
-->x(1,:) // ans = 0.2113249 0.3303271
==========================READ/WRITE_FILES===================================================
-->x = rand(3, 2) // load a 4 x 4 constant matrix
x = 0.8497452 0.0683740
0.6857310 0.5608486
0.8782165 0.6623569
-->x(1,2) // ans = 0.0683740
-->path='/Users/donsauer/Downloads/scilab/' // directory to save files
-->save(path+'BinFile.sci', x) // Save x as a Binary file
-->clear x // x is clear
-->x // !--error 4 Undefined variable: x
-->load(path+'BinFile.sci') // Load from Binary file the x array
-->x
x = 0.8497452 0.0683740
0.6857310 0.5608486
0.8782165 0.6623569
-->write(path+'TextFile.out', x) // Save x as a Text file same rows/cols
-->z1 = read(path+'TextFile.out', 2, 2) // Read from Text file rows, colls
z1 = 0.8497452 0.0683740
0.6857310 0.5608486
-->z1 = read('TextFile.out', 3, 2); // ";" stops the print out
==========================PLOT2D===================================================
-->x = linspace(-10, 10, 5) // x = - 10. - 5. 0. 5. 10.
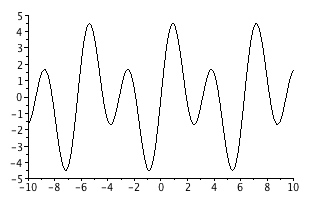
-->x = linspace(-10, 10, 1000); // x from -10 to 10 in 1000 steps
-->y = 2*sin(x) + 3*sin(2*x) ;
-->plot2d(x,y) // x y plot
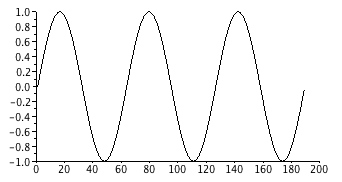
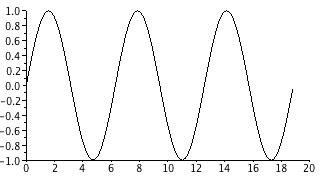
-->t=(0:0.1:6*%pi); // t is 0->6*%pi in 0.1 steps
-->plot2d(sin(t)'); // plot vs numb of points
-->clf(); // clears graph
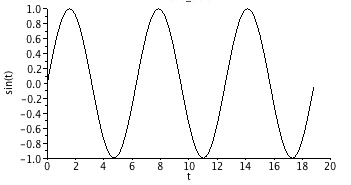
-->plot2d(t',sin(t)');
// plot vs t value
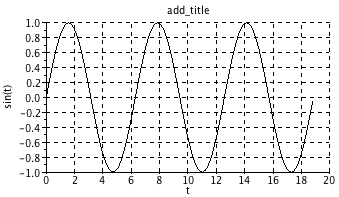
-->xtitle("add_title","t","sin(t)");
//
xtitle("title","x_lab","y_lab");
-->xgrid(); //xgrid([color]) add a grid
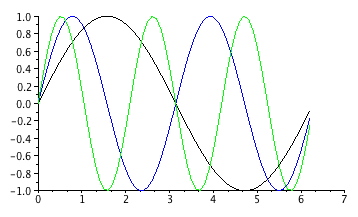
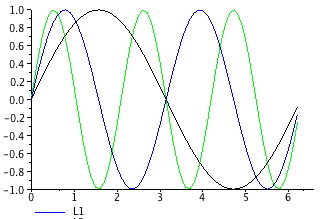
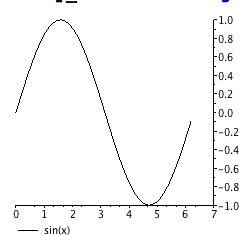
-->x=[0:0.1:2*%pi]';
-->plot2d(x,[sin(x) sin(2*x) sin(3*x)]) //multiple plot
-->x=[0:0.1:2*%pi]';
-->plot2d(x,[sin(x)
sin(2*x)],[1,2],leg="L1@L2"); //legends
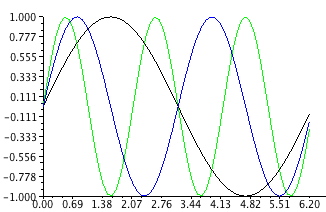
-->plot2d(x,[sin(x) sin(2*x)],nax=[2,10,2,10]); // axes labels/tics [nx,Nx,ny,Ny]
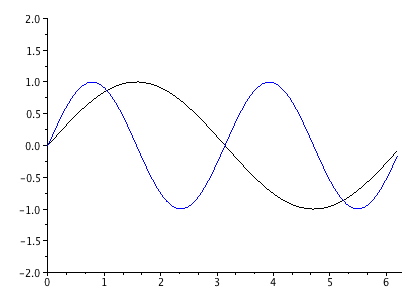
-->plot2d(x,[sin(x) sin(2*x)],rect=[0,-2,2*%pi,2]); //view window [xmin,ymin,xmax,ymax]
-->clf();
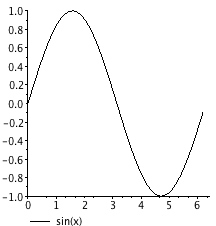
-->x=[0:0.1:2*%pi]';
-->plot2d(x,sin(x),leg="sin(x)");
//
add legend
-->a=gca(); // gca() returns Handle on axes entity
-->a.y_location ="right"; // axis on the right
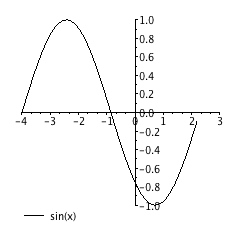
-->clf();
-->plot2d(x-4,sin(x),1,leg="sin(x)");
// Offset x on plot
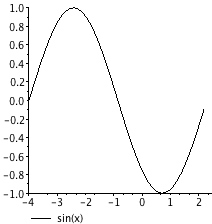
-->a=gca(); // gca() returns Handle on axes entity
-->a.x_location = "middle";
-->a.y_location = "middle"; // axis centered at (0,0)
-->clf();
-->plot2d(x,sin(x),1,frameflag=
4);
// isoview
-->clf();
-->plot2d(x,sin(x),1,frameflag= 6); // scale
-->clf();
-->plot2d(x,sin(x), -1); // auto scaling with previous plots + style
-->plot2d(x,2*sin(x),12);
-->plot2d(2*x,cos(x), 3);
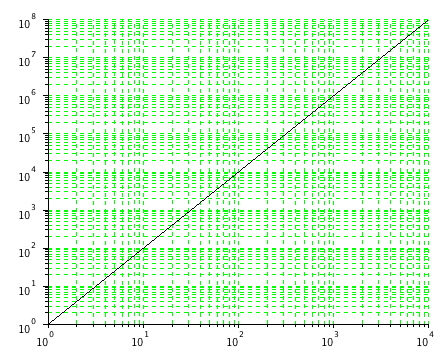
==========================PLOT2D_SEMILOG===================================================
-->x=(1:10:10000); // x is 1->10000 stepsize =10
-->y=x^2; // y=x^2 print out values
-->plot2d(x,y, logflag="ll" ) // logx/logy plot
-->xgrid(3);
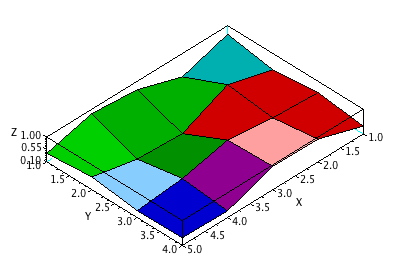
==========================PLOT3D===================================================
-->z = rand(5, 4) // Z = 5 row 4 col
z = 0.6856896 0.4094825 0.5896177 0.3873779
0.1531217 0.8784126 0.6853980 0.9222899
0.6970851 0.1138360 0.8906225 0.9488184
0.8415518 0.1998338 0.5042213 0.3435337
0.4062025 0.5618661 0.3493615 0.3760119
-->x=[1:1:5]; // x = 1 2 3 4 5
-->y=[1:1:4]; // y = 1 2 3 4
-->[xx,yy,zz]=genfac3d(x,y,z); // maps z to 3D
-->plot3d1(xx,yy,zz)
-->t=[0:0.3:2*%pi]';
-->z=sin(t)*cos(t'); // simple plot using z=f(x,y)
-->plot3d1(t,t,z)
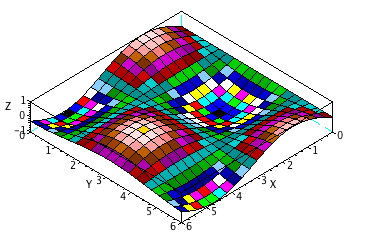
-->[xx,yy,zz]=genfac3d(t,t,z); // same plot using facets computed by genfac3d
-->clf();
-->plot3d1(xx,yy,zz)
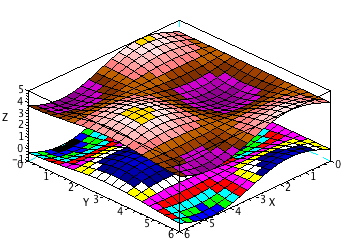
-->clf();
-->plot3d1([xx xx],[yy yy],[zz 4+zz]) // multiple plots
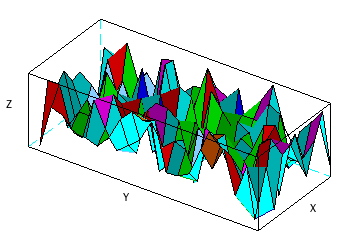
-->clf() ;
-->plot3d1(1:10,1:20,10*rand(10,20),35,45,"X@Y@Z",[2,2,3]) // with viewpoint and captions
==========================SOUND===================================================
-->t=soundsec(0.5); // soundsec(sec [,Int_samp/sec])
-->[nr,nc]=size(t) // find size array t nr=1 nc=11025.
-->s=sin(440*t)+sin(220*t)/2+sin(880*t)/2; // create sound array s
-->plot2d(s); // plot s vs index
-->plot2d(t,s); // plot s vs time
-->plot2d(s(100:600)) // plot subset of s
-->s=s/max(abs(s)); // normalize s
-->plot2d(s);
-->path='/Users/donsauer/Downloads/scilab/' // directory to save files
-->savewave( path+'SaveSound.wav',s); // save s as a wave file
-->write( path+ 'waveData.out' ,s); // save s as a text file
-->s1=loadwave(path+'SaveSound.wav'); // reload wave file
-->plot2d(s1);
-->[y,Fs,bits]=wavread(path+'SaveSound.wav') // load unknown y=wave bits=16 Fs=22050
-->plot2d(y);
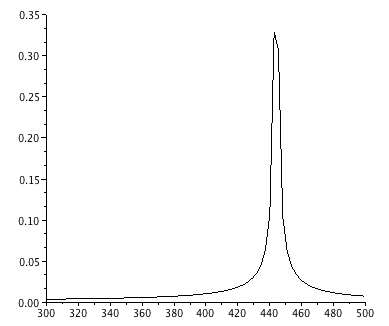
-->t=soundsec(0.5); // create 0.5 seconds of sound parameters.
-->s=sin(2*%pi*440*t);
// Then we generate the sound.
-->analyze(s);
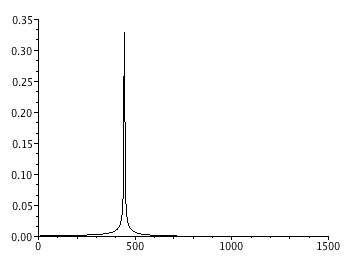
-->analyze(s,300,500,22050); // freq plot fmin,fmax,rate,points
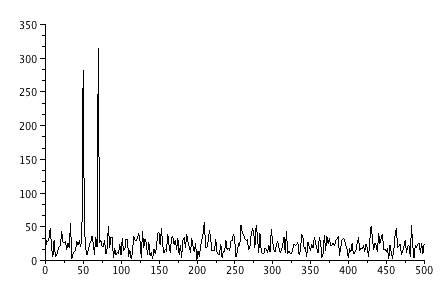
-->sample_rate=1000;
-->t = 0:1/sample_rate:0.6; // at 50 and 70 Hz
-->N=size(t,'*'); //number of samples
-->s=sin(2*%pi*50*t)+sin(2*%pi*70*t+%pi/4)+grand(1,N,'nor',0,1);
-->y=fft(s); // fft retain only first N/2 points
-->f=sample_rate*(0:(N/2))/N; // create frequency vector
-->n=size(f,'*')
-->clf()
-->plot2d(f,abs(y(1:n)))
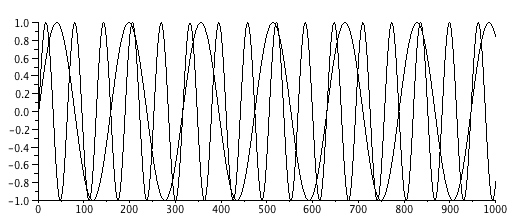
-->t=soundsec(0.5); // sound
-->s3 =[sin(2*%pi*140*t);sin(2*%pi*350*t)]; // Generate two channels sound.
-->plot2d( s3(1,1:1000) )
-->plot2d( s3(2,1:1000) )
==========================BODE===================================================
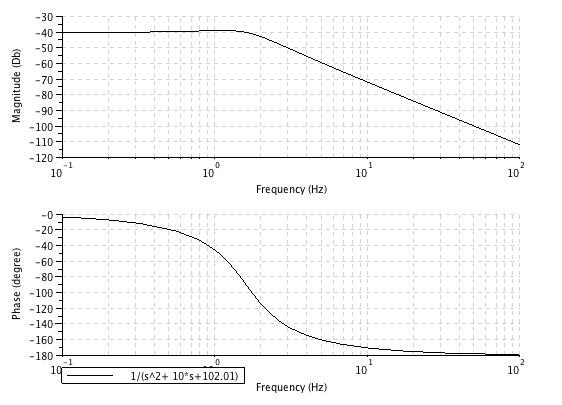
-->s=poly(0,'s') // define s as a poly symbol
-->h=syslin('c', 1 /(s^2+ 10*s+102.01)) // transfer function 'c'= continue time,'d' discrete
-->titl='1/(s^2+ 10*s+102.01)'; // define title
-->bode(h,0.1,100,titl);
-->halt
==========================READEXCEL===========================================
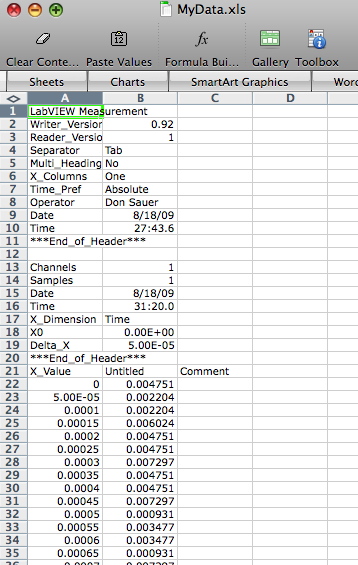
path='/Users/donsauer/Documents/KEY/KEY10/scilab/'
Sheets = readxls(path+'MyData.xls') // need to resave 2 old excel
s1=Sheets(1); // get the first sheet
[nr,nc]=size(s1) // nc= 3 nr = 509
s1(19,1) // Delta_X
s1(19,2) // 0.00025
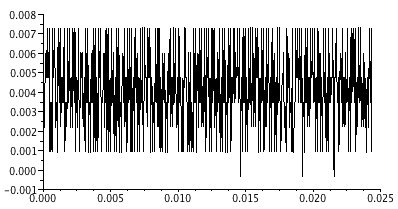
w3(:,1)=s1(22:nr,1); // skip first 22 lines
w3(:,2)=s1(22:nr,2); // skip first 22 lines
plot2d(w3(:,1)',w3(:,2)') // plot w3() as time/val
==========================FFT_in_3D===========================================
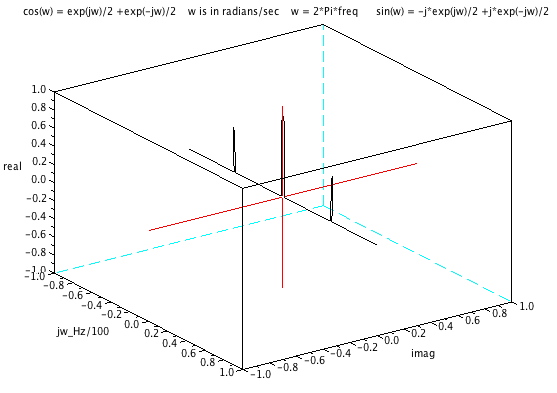
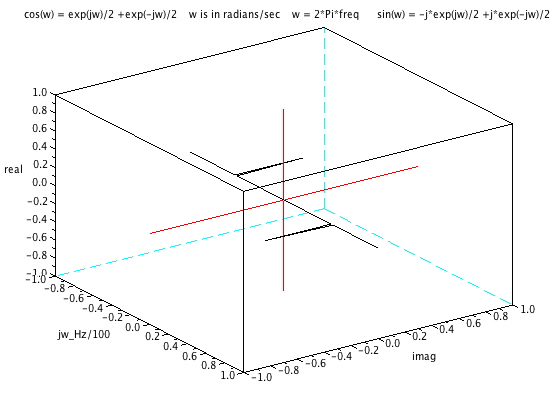
//=================Plot_Cosine_and_DC_In_3D====================================
ns =10000; // set sample rate @ 10K samples/sec
x = linspace(0,1,ns ); // make 1000 x points from 0-> 1 secs
[nc,nr]=size(x); // nc = 1 nr = 10000
yc = cos(2*%pi*50*x)+.9 ; // make carrier signal 50Hz
for i=1:nr, y(i)= yc(i) ; end; // modulate can be done here
yfft = fft(y); // fft retains only first N/2 points
f = nr*(0:(nr/2))/nr; // create frequency vector
nf=size(f,'*') // check size of freq vector
fr= real(yfft(1:nf)/nr); // find real of fft
fi= imag(yfft(1:nf)/nr); // find imag of fft
for i=1:100, b(i) =i ; end; // make a bin array to plot first 100 bins
param3d( b/100, fi(b),fr(b),-35,57,"jw_Hz/100@imag@real",[1,4],[-1,1,-1,1,-1,1]);
//param3d(x,y,z,theta,alpha,"xlabel@ylabel@zlabel",[size],[xmin,xmax,ymin,ymax,zmin,zmax]);
param3d(-b/100,-fi(b),fr(b),-35,57,"jw_Hz/100@imag@real",[1,4],[-1,1,-1,1,-1,1]);
for i=1:100, zer(i) =0 ; end; //make a zero array
param3d(zer(b),b/100,zer(b),-35,57,"jw_Hz/100@imag@real",[1,4],[-1,1,-1,1,-1,1]);
e=gce(); e.foreground=color('red'); //the handle on the 3D polyline
param3d(zer(b),-b/100,zer(b),-35,57,"jw_Hz/100@imag@real",[1,4],[-1,1,-1,1,-1,1]);
e=gce(); e.foreground=color('red'); //the handle on the 3D polyline
param3d(zer(b),zer(b),-b/100,-35,57,"jw_Hz/100@imag@real",[1,4],[-1,1,-1,1,-1,1]);
e=gce(); e.foreground=color('red'); //the handle on the 3D polyline
param3d(zer(b),zer(b),b/100,-35,57,"jw_Hz/100@imag@real",[1,4],[-1,1,-1,1,-1,1]);
e=gce(); e.foreground=color('red'); //the handle on the 3D polyline
xtitle("cos(w) = exp(jw)/2 +exp(-jw)/2 w is in radians/sec w = 2*Pi*freq sin(w) = -j*exp(jw)/2 +j*exp(-jw)/2")
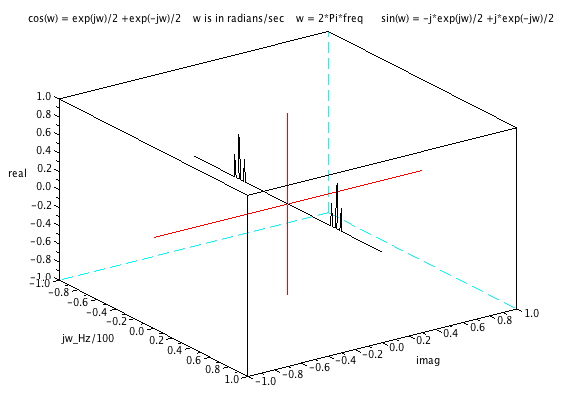
//=================Plot_Sine_In_3D=============================================
ns =10000; // set sample rate @ 10K samples/sec
x = linspace(0,1,ns ); // make 1000 x points from 0-> 1 secs
[nc,nr]=size(x); // find size of array
yc = sin(2*%pi*50*x) ; // make carrier signal 50Hz
for i=1:nr, y(i)= yc(i) ; end; // modulate here
yfft = fft(y); // fft retain only first N/2 points
f = nr*(0:(nr/2))/nr; // create frequency vector
nf=size(f,'*') // check size of freq vector
fr= real(yfft(1:nf)/nr); // find real of fft
fi= imag(yfft(1:nf)/nr); // find imag of fft
for i=1:100, b(i) =i ; end; // make a bin array to plot first 100 bins
param3d( b/100, fi(b),fr(b),-35,57,"jw_Hz/100@imag@real",[1,4],[-1,1,-1,1,-1,1]);
//param3d(x,y,z,theta,alpha,"xlabel@ylabel@zlabel",[size],[xmin,xmax,ymin,ymax,zmin,zmax]);
param3d(-b/100,-fi(b),fr(b),-35,57,"jw_Hz/100@imag@real",[1,4],[-1,1,-1,1,-1,1]);
for i=1:100, zer(i) =0 ; end; //make a zero array
param3d(zer(b),b/100,zer(b),-35,57,"jw_Hz/100@imag@real",[1,4],[-1,1,-1,1,-1,1]);
e=gce(); e.foreground=color('red'); //the handle on the 3D polyline
param3d(zer(b),-b/100,zer(b),-35,57,"jw_Hz/100@imag@real",[1,4],[-1,1,-1,1,-1,1]);
e=gce(); e.foreground=color('red'); //the handle on the 3D polyline
param3d(zer(b),zer(b),-b/100,-35,57,"jw_Hz/100@imag@real",[1,4],[-1,1,-1,1,-1,1]);
e=gce(); e.foreground=color('red'); //the handle on the 3D polyline
param3d(zer(b),zer(b),b/100,-35,57,"jw_Hz/100@imag@real",[1,4],[-1,1,-1,1,-1,1]);
e=gce(); e.foreground=color('red'); //the handle on the 3D polyline
xtitle("cos(w) = exp(jw)/2 +exp(-jw)/2 w is in radians/sec w = 2*Pi*freq sin(w) = -j*exp(jw)/2 +j*exp(-jw)/2")
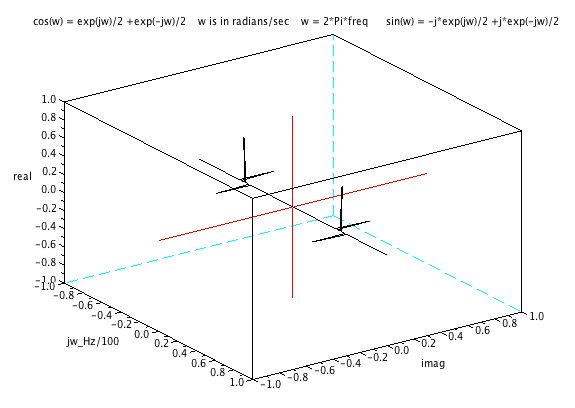
//===============Plot_AM_with_Cosine_In_3D=============================================
ns =10000; // set sample rate @ 10K samples/sec
x = linspace(0,1,ns ); // make 1000 x points from 0-> 1 secs
[nc,nr]=size(x); // find size of array
ym = 1+cos(2*%pi*5*x); // make modulation signal 5Hz
yc = cos(2*%pi*50*x); // make carrier signal 50Hz
for i=1:nr, y(i)=ym(i)*yc(i) ; end; // Amplitude modulate
yfft = fft(y); // fft retain only first N/2 points
f = nr*(0:(nr/2))/nr; // create frequency vector
nf=size(f,'*') // check size of freq vector
fr= real(yfft(1:nf)/nr); // find real of fft
fi= imag(yfft(1:nf)/nr); // find imag of fft
for i=1:100, b(i) =i ; end; // make a bin array to plot first 100 bins
param3d( b/100, fi(b),fr(b),-35,57,"jw_Hz/100@imag@real",[1,4],[-1,1,-1,1,-1,1]);
//param3d(x,y,z,theta,alpha,"xlabel@ylabel@zlabel",[size],[xmin,xmax,ymin,ymax,zmin,zmax]);
param3d(-b/100,-fi(b),fr(b),-35,57,"jw_Hz/100@imag@real",[1,4],[-1,1,-1,1,-1,1]);
for i=1:100, zer(i) =0 ; end; //make a zero array
param3d(zer(b),b/100,zer(b),-35,57,"jw_Hz/100@imag@real",[1,4],[-1,1,-1,1,-1,1]);
e=gce(); e.foreground=color('red'); //the handle on the 3D polyline
param3d(zer(b),-b/100,zer(b),-35,57,"jw_Hz/100@imag@real",[1,4],[-1,1,-1,1,-1,1]);
e=gce(); e.foreground=color('red'); //the handle on the 3D polyline
param3d(zer(b),zer(b),-b/100,-35,57,"jw_Hz/100@imag@real",[1,4],[-1,1,-1,1,-1,1]);
e=gce(); e.foreground=color('red'); //the handle on the 3D polyline
param3d(zer(b),zer(b),b/100,-35,57,"jw_Hz/100@imag@real",[1,4],[-1,1,-1,1,-1,1]);
e=gce(); e.foreground=color('red'); //the handle on the 3D polyline
xtitle("cos(w) = exp(jw)/2 +exp(-jw)/2 w is in radians/sec w = 2*Pi*freq sin(w) = -j*exp(jw)/2 +j*exp(-jw)/2")
//===============Plot_AM_with_Sine_In_3D=============================================
ns =10000; // set sample rate @ 10K samples/sec
x = linspace(0,1,ns ); // make 1000 x points from 0-> 1 secs
[nc,nr]=size(x); // find size of array
ym = 1+sin(2*%pi*5*x); // make modulation signal 5Hz
yc = cos(2*%pi*50*x); // make carrier signal 50Hz
for i=1:nr, y(i)=ym(i)*yc(i) ; end; // Amplitude modulate
yfft = fft(y); // fft retain only first N/2 points
f = nr*(0:(nr/2))/nr; // create frequency vector
nf=size(f,'*') // check size of freq vector
fr= real(yfft(1:nf)/nr); // find real of fft
fi= imag(yfft(1:nf)/nr); // find imag of fft
for i=1:100, b(i) =i ; end; // make a bin array to plot first 100 bins
param3d( b/100, fi(b),fr(b),-35,57,"jw_Hz/100@imag@real",[1,4],[-1,1,-1,1,-1,1]);
//param3d(x,y,z,theta,alpha,"xlabel@ylabel@zlabel",[size],[xmin,xmax,ymin,ymax,zmin,zmax]);
param3d(-b/100,-fi(b),fr(b),-35,57,"jw_Hz/100@imag@real",[1,4],[-1,1,-1,1,-1,1]);
for i=1:100, zer(i) =0 ; end; //make a zero array
param3d(zer(b),b/100,zer(b),-35,57,"jw_Hz/100@imag@real",[1,4],[-1,1,-1,1,-1,1]);
e=gce(); e.foreground=color('red'); //the handle on the 3D polyline
param3d(zer(b),-b/100,zer(b),-35,57,"jw_Hz/100@imag@real",[1,4],[-1,1,-1,1,-1,1]);
e=gce(); e.foreground=color('red'); //the handle on the 3D polyline
param3d(zer(b),zer(b),-b/100,-35,57,"jw_Hz/100@imag@real",[1,4],[-1,1,-1,1,-1,1]);
e=gce(); e.foreground=color('red'); //the handle on the 3D polyline
param3d(zer(b),zer(b),b/100,-35,57,"jw_Hz/100@imag@real",[1,4],[-1,1,-1,1,-1,1]);
e=gce(); e.foreground=color('red'); //the handle on the 3D polyline
xtitle("cos(w) = exp(jw)/2 +exp(-jw)/2 w is in radians/sec w = 2*Pi*freq sin(w) = -j*exp(jw)/2 +j*exp(-jw)/2")
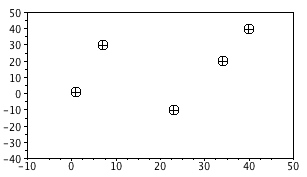
==========================INTERPOLATION===========================================
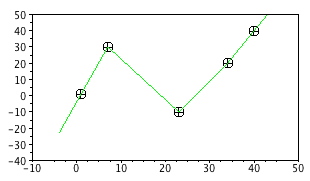
x=[1 7 23 34 40]; // make 5 increasing points
[nc,nr]=size(x) // nr=5 nc=1
y=[1 30 -10 20 40]; // make 5 random points
[nc,nr]=size(y) // nr=5 nc=1 1
plot2d(x',y',[-3],"011"," ",[-10,-40,50,50]);
// [pt=-3],"0=no_caption,1=use_rect_size,1=use_axis","legend",[rect_data]
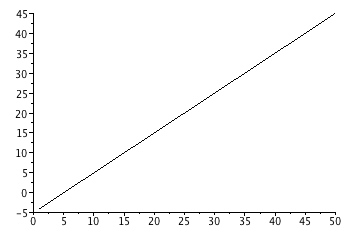
yi=interpln([x;y],-4:45); // make yi equal 50 x/y points from -4 to 45
plot2d((-4:45)',yi',[3],"000"); // plot yi from -4 to 45
//[line=3],"0=no_caption,0=use_prev_size,0=no_axis"
[nc,nr]=size(yi)
plot2d(-4:45); // nr=50 1
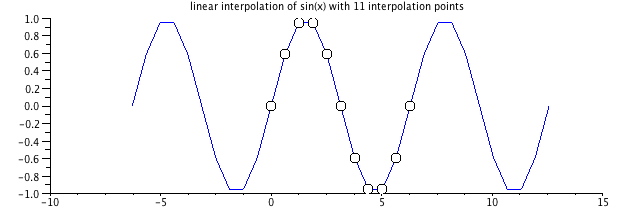
x = linspace(0,2*%pi,11); // make 11 x points from 0-> 2*%pi
y = sin(x); // make 11 y points from x
xx = linspace(-2*%pi,4*%pi,400)'; // make 400 xx points from -2*%pi-> 4*%pi
yy = linear_interpn(xx, x, y, "periodic"); // make 400 yy point to match xx using x/y
xbasc() // clear graph
plot2d(xx,yy,style=2) // plot xx/yy as lines
plot2d(x,y,style=-9, strf="000") // plot x/y a points
xtitle("linear interpolation of sin(x) with 11 interpolation points")
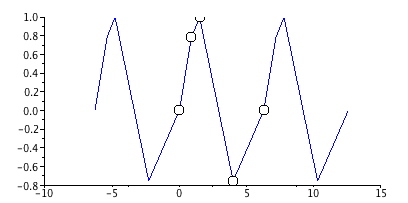
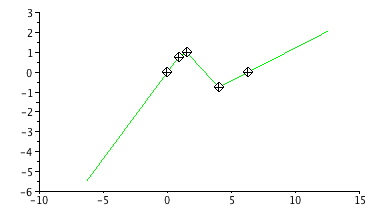
x= [0 .9 1.5 4 2*%pi]; // make 5 x points from 0-> 2*%pi
y = sin(x); // make 5 y points from x
xx = linspace(-2*%pi,4*%pi,400)'; // make 400 xx points from -2*%pi-> 4*%pi
yy = linear_interpn(xx, x, y, "periodic"); // make 400 yy point to match xx using x/y
xbasc() // clear graph
plot2d(xx,yy,style=2) // plot xx/yy as lines style=2
plot2d(x,y,style=-9, strf="000") // plot x/y as points style=-9
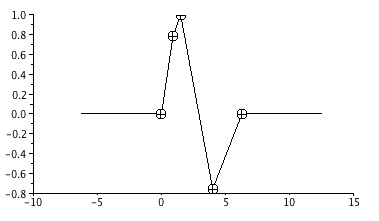
yy = linear_interpn(xx, x, y, "natural"); // use natural style to make yy
xbasc() // clears a graphics window
plot2d(xx,yy,style=3) // plot xx/yy as lines style=3
plot2d(x,y,style=-8, strf="000") // plot x/y as points style=-8
yy = linear_interpn(xx, x, y, "by_zero"); // use by_zero style to make yy
xbasc() // clears a graphics window
plot2d(xx,yy,style=1) // plot xx/yy as lines style=1
plot2d(x,y,style=-3, strf="000") // plot x/y as points style=-3
yy = linear_interpn(xx, x, y, "by_nan"); // use by_zero style to make yy
xbasc() // clears a graphics window
plot2d(xx,yy,style=5) // plot xx/yy as lines style=5
plot2d(x,y,style=-1, strf="000") // plot x/y as points style=-1
=======================SPICE_TO_WAV_FILE================================
==========================RUN_THIS_SPICE_FILE===================================
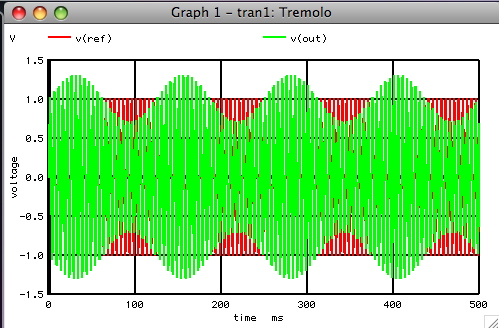
Tremolo
* dsauersanjose@aol.com 9/11/09
* www.idea2ic.com
*
* AM Signal
*
* Vtime ^ OUT ^ REF
* ____ /_\ /_\
* VT _|_ | _|_ _|_
* /_ \ | /_ \ B1 /_ \ Vref
* // \ \ |_// \ \ // \ \
* \ \// \ \// \ \//
* \___/ \___/ \___/ Reference
* | | | Signal
* _|_ _|_ _|_
* /// /// ///
*
*
* spec start_f stop_f step_f vector [vector ...]
* spec 2 2k 2 v(out) spec 2Hz->2kHz @ 2Hz steps
* .tran TSTEP TSTOP TSTART TMAX ?UIC?
*======== ====== ====== ====== ====== ====== ====== ====== ====== ====== ======
VT Vtime 0 PWL ( 0 0 1 1 )
B1 OUT 0 V = sin(2*3.142*200*v(Vtime))*(1 +.3*sin(2*3.142*8*v(Vtime)))
Vref REF 0 dc = 0 sin( 0 1 200 )
.tran .1m 1 0 .1m
.control
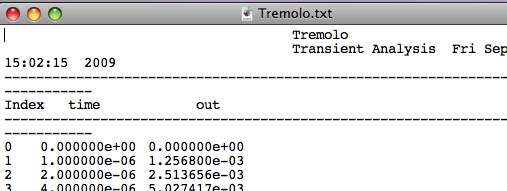
set outfile = "Tremolo.txt"
set pensize = 2
run
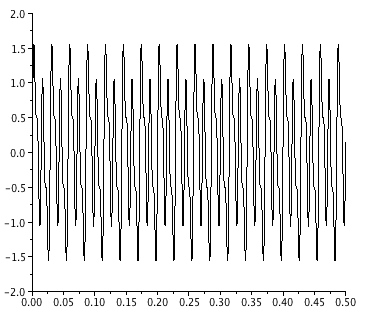
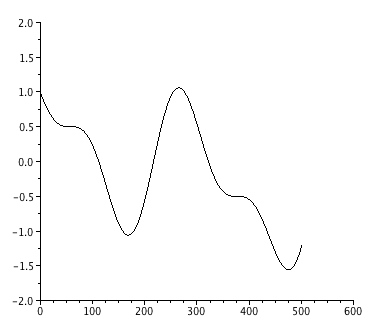
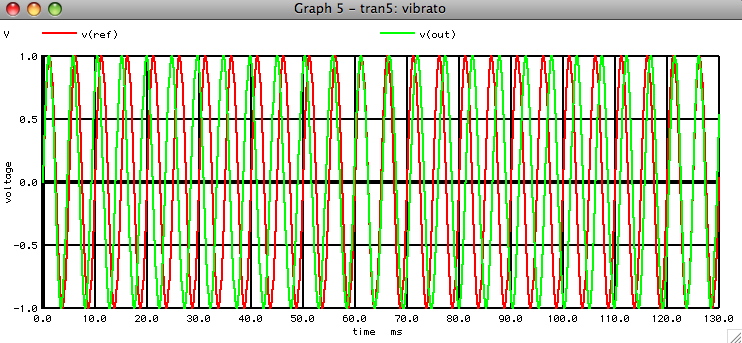
plot v(ref) v(out) xlimit 0 500m
print out > $outfile
.endc
.end
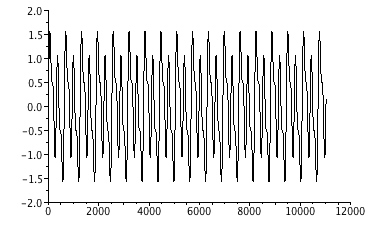
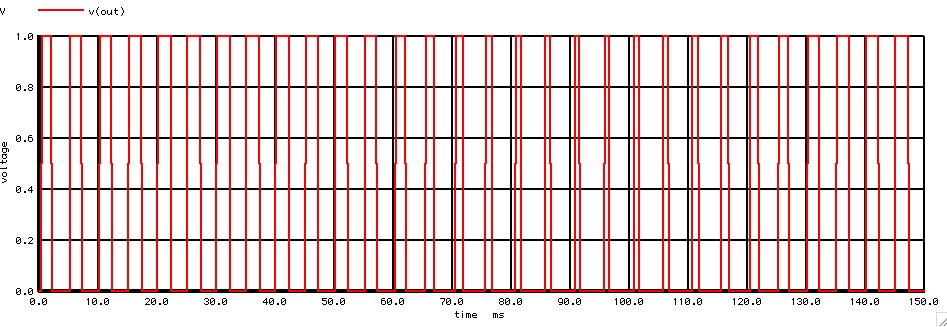
====================WILL_PRODUCE_THIS_PLOT===================================
====================WILL_PRODUCE_THIS_TEXTFILE===================================
====================USE_FIND_AND_REPLACE_TO_REFORMAT===================================
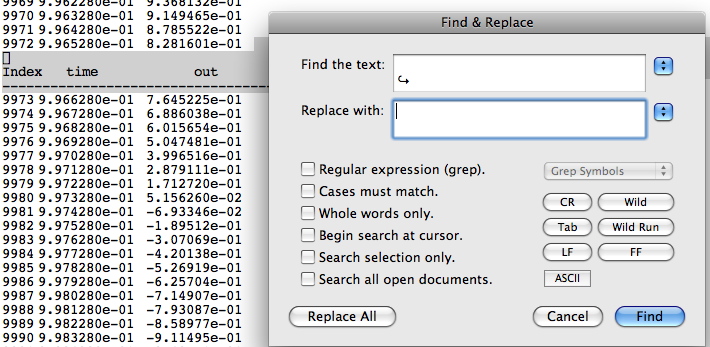
====================NEED_TO_USE_LINEFEEDS===================================
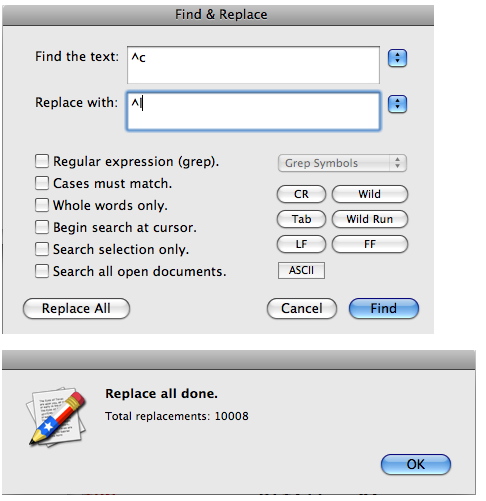
================THE_TEXT_FILE_IS_NOW_FORMATED_TO_3COLS_X_10008ROWS=======================
path='/Users/Your_Dir_Path/' // where you put your files
z1 = read(path+'Tremolo.txt', 10008,3); // Read in Text file
[nr,nc]=size(z1); // nr =10008 , nc = 3
for i=1:nr, t0(i) =z1(i,2) ; end; // read second column into t0
for i=1:nr, v0(i) =z1(i,3) ; end; // read third column into v0
t= soundsec(1); // soundsec(sec ) in standard audio
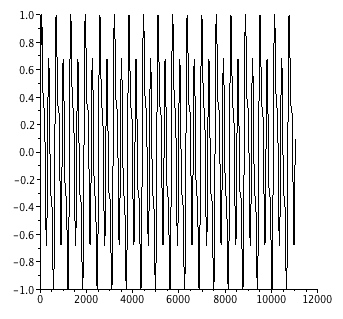
s = linear_interpn(t, t0, v0, "periodic"); // interpolates spice wave to audio format
plot2d(t',s) // s is formated to standard audio
savewave( path+'Tremolo.wav',s); // save s as a wave file
================REPEAT_FOR_VIBRATO_AND_TRILL=======================
The LFO can be routed to modulate almost any module of the synth. An LFO (LowFreqOsc) routed to the VCO (VoltCtnlOsc)
creates a change in pitch (vibrato). A LFO routed through the VCF (VoltCntlFilter) will alter the tone color of the sound (trill).
Modulating the VCA (VoltCntlAmp) will change the amplitude(tremolo) .
THIS_WEBPAGE_CAN_PLAY_THE_SOUNDS